

LESS BUSYWORK. BETTER DECISIONS.
Turn manual reporting into a decision system your leadership can trust.
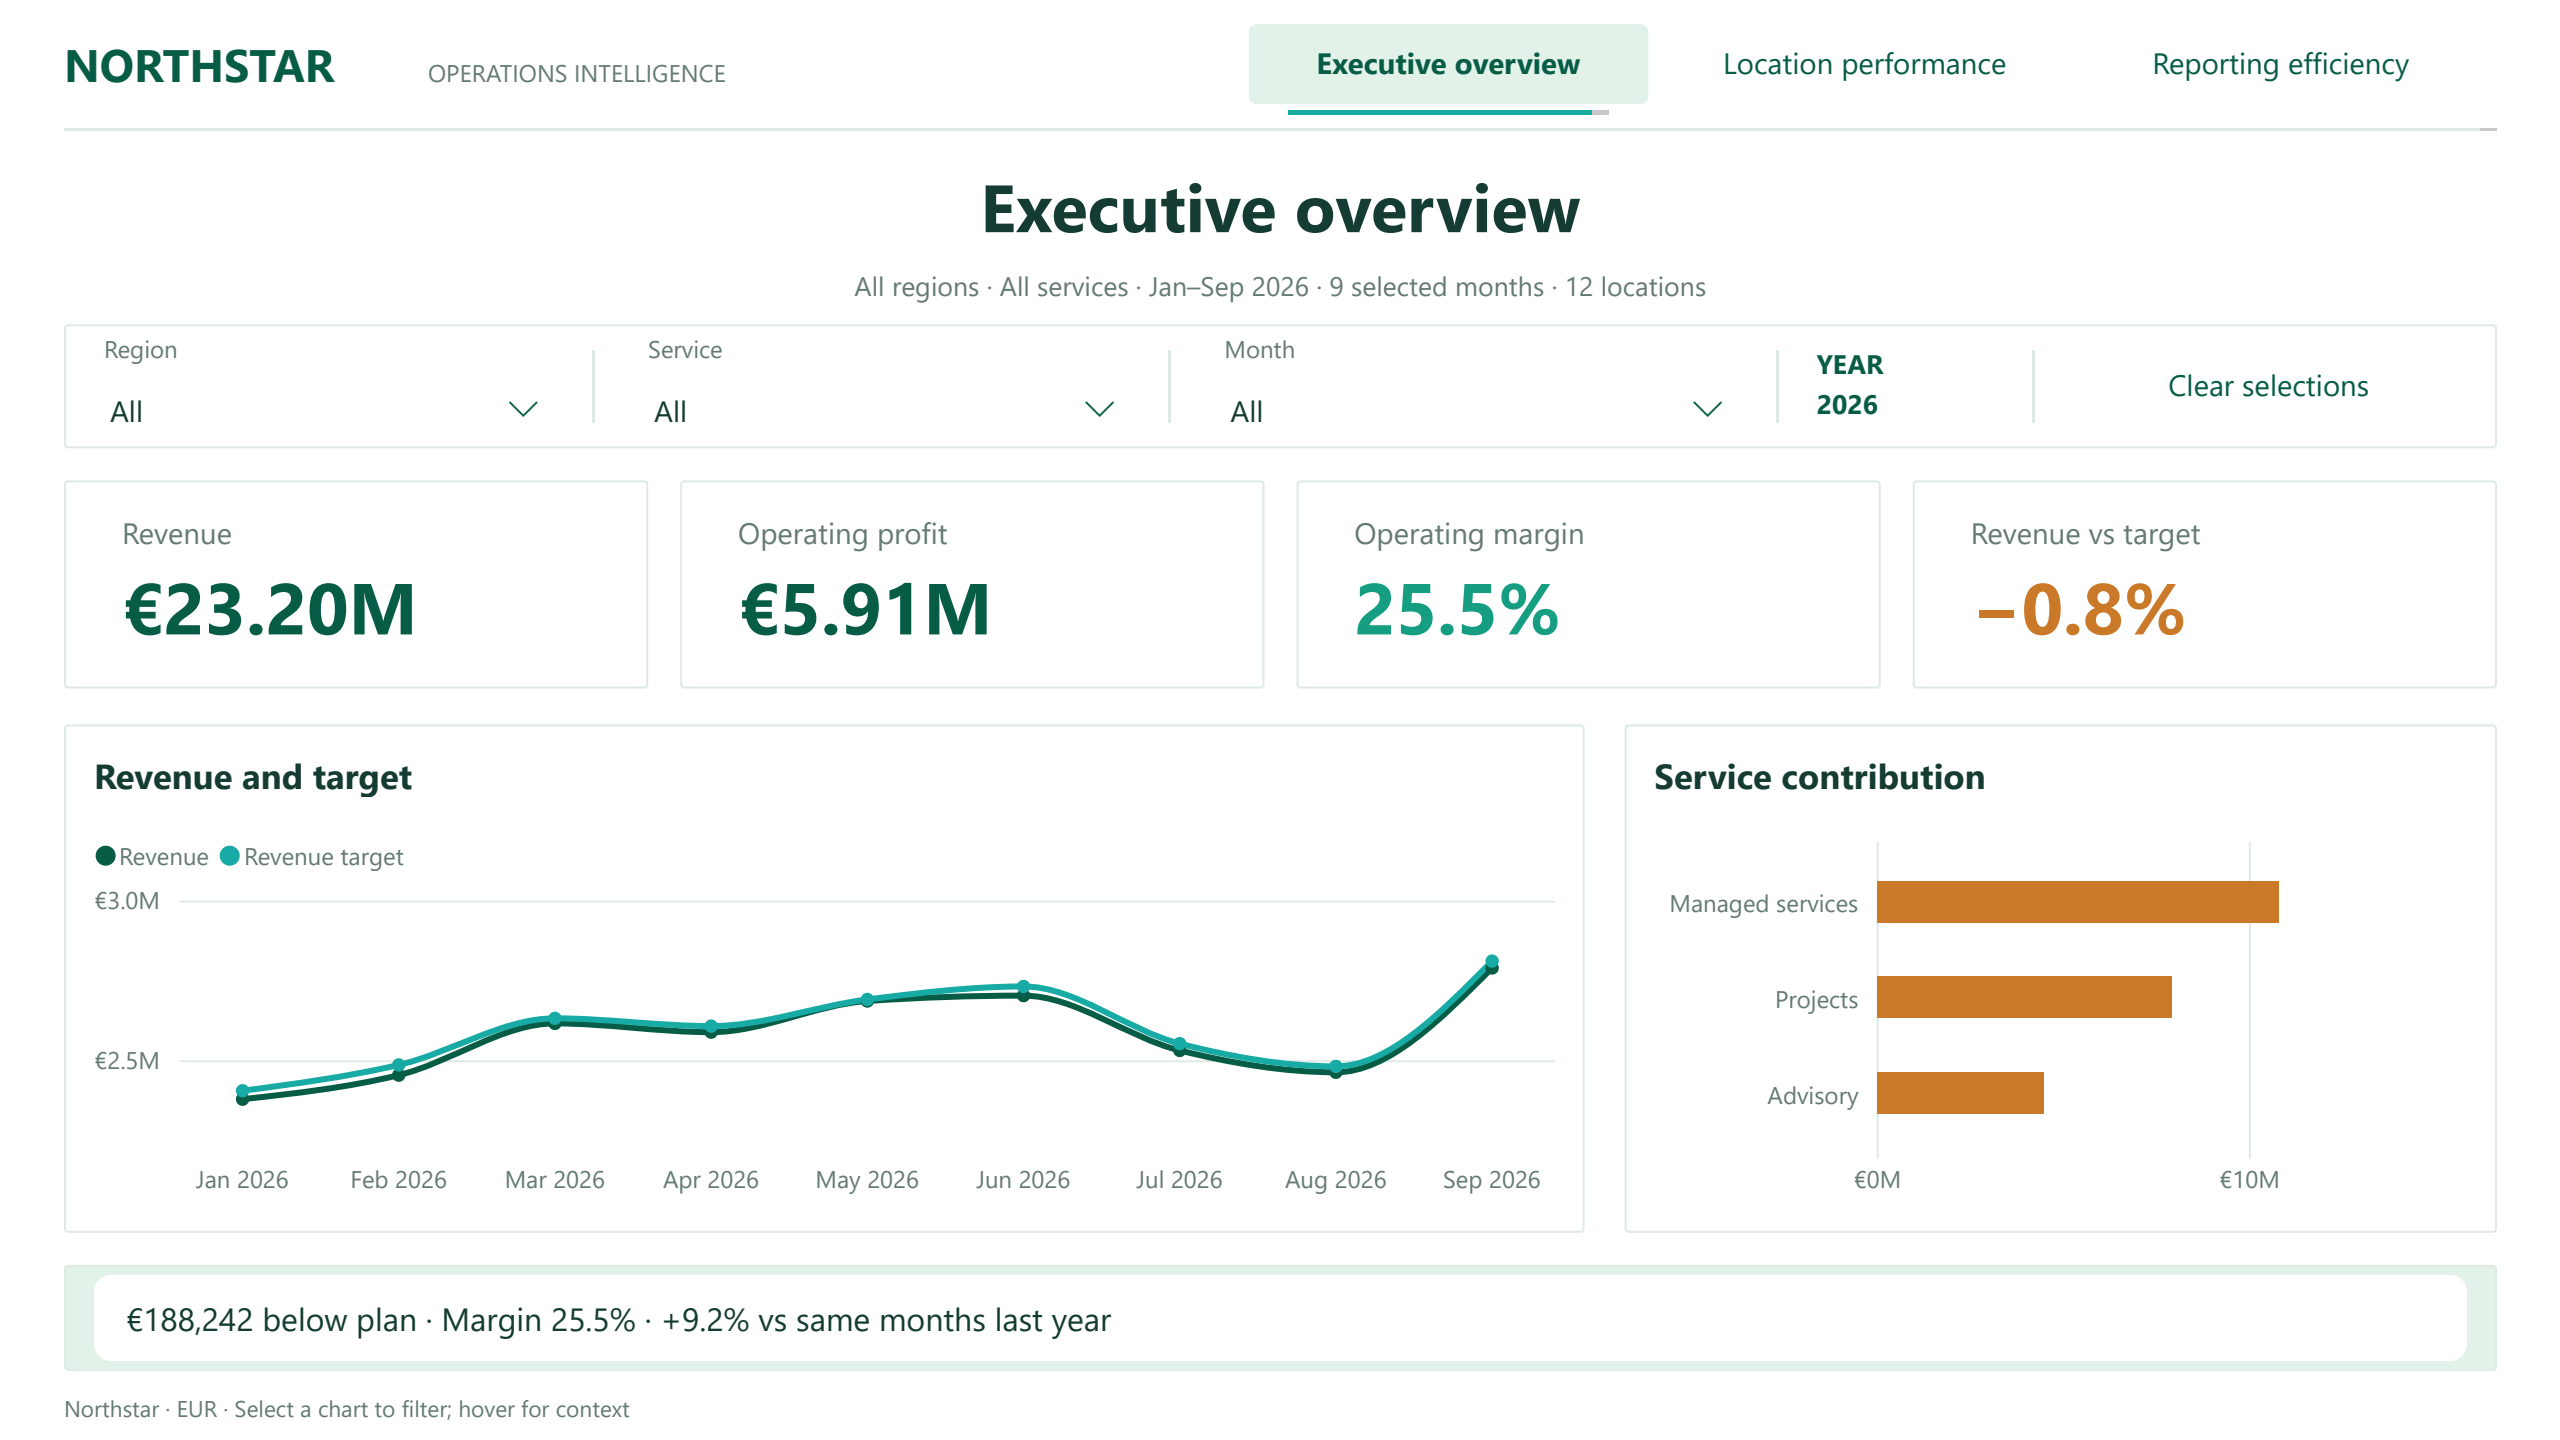
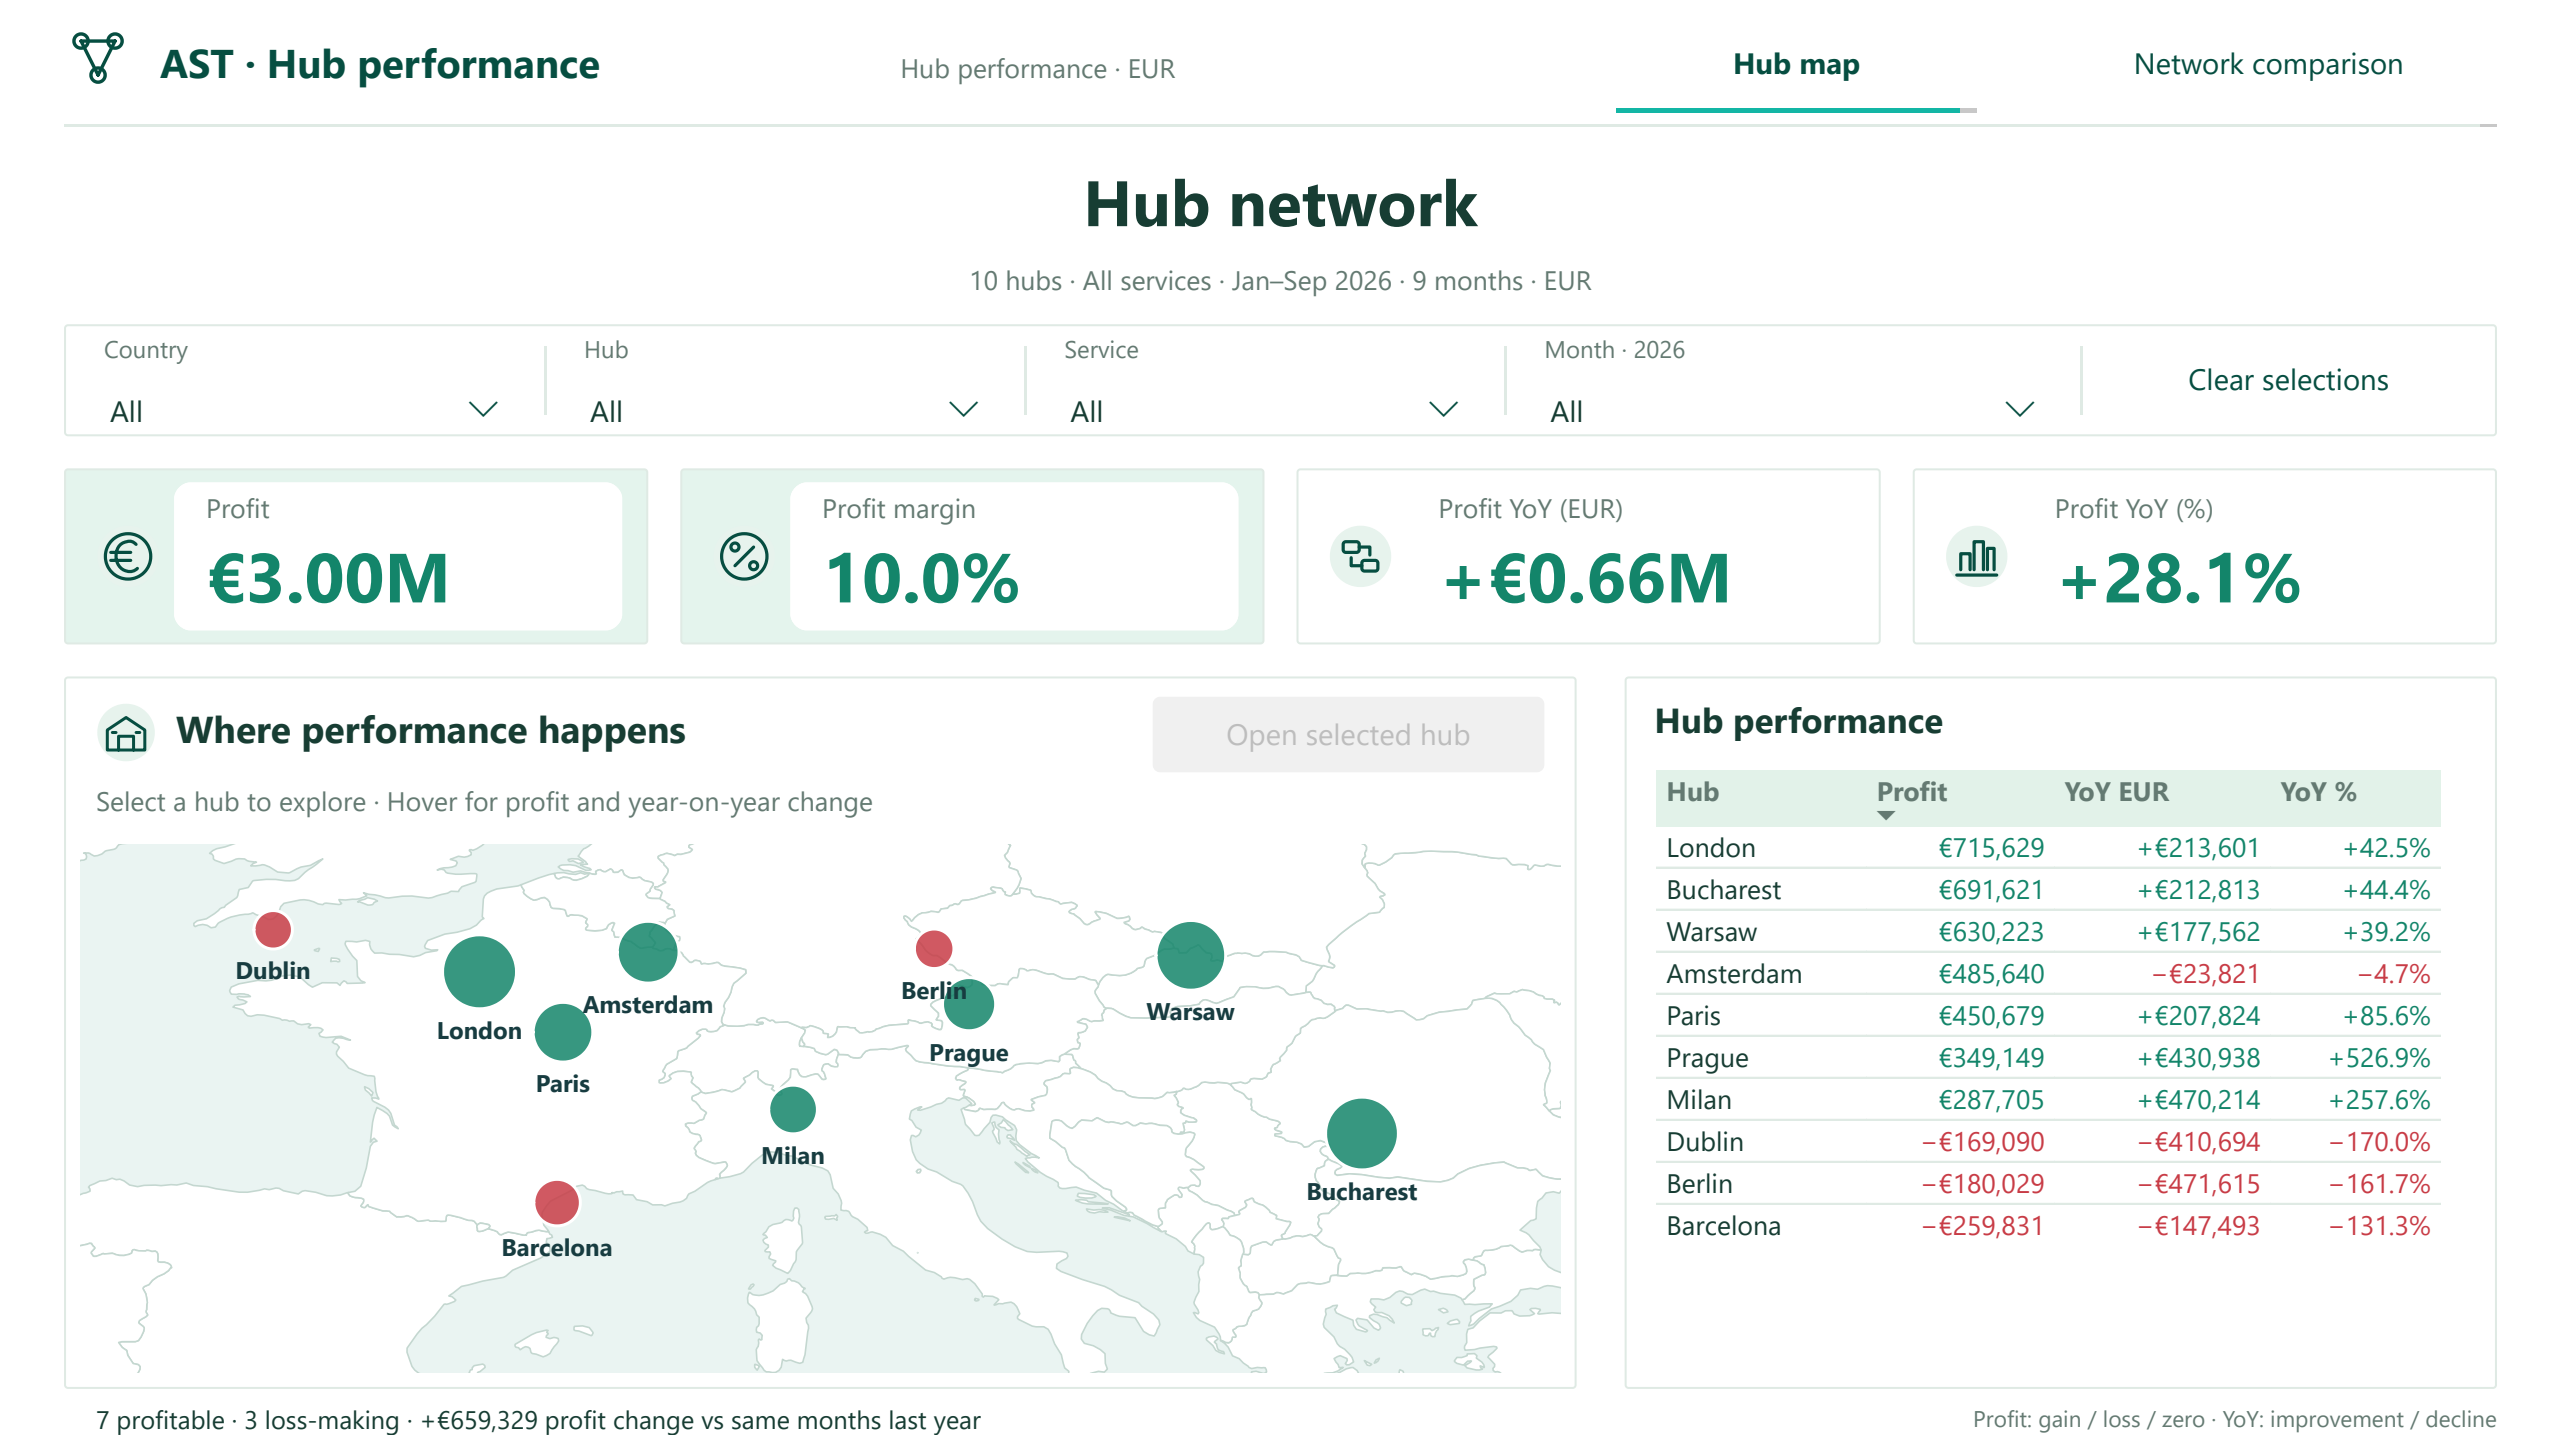
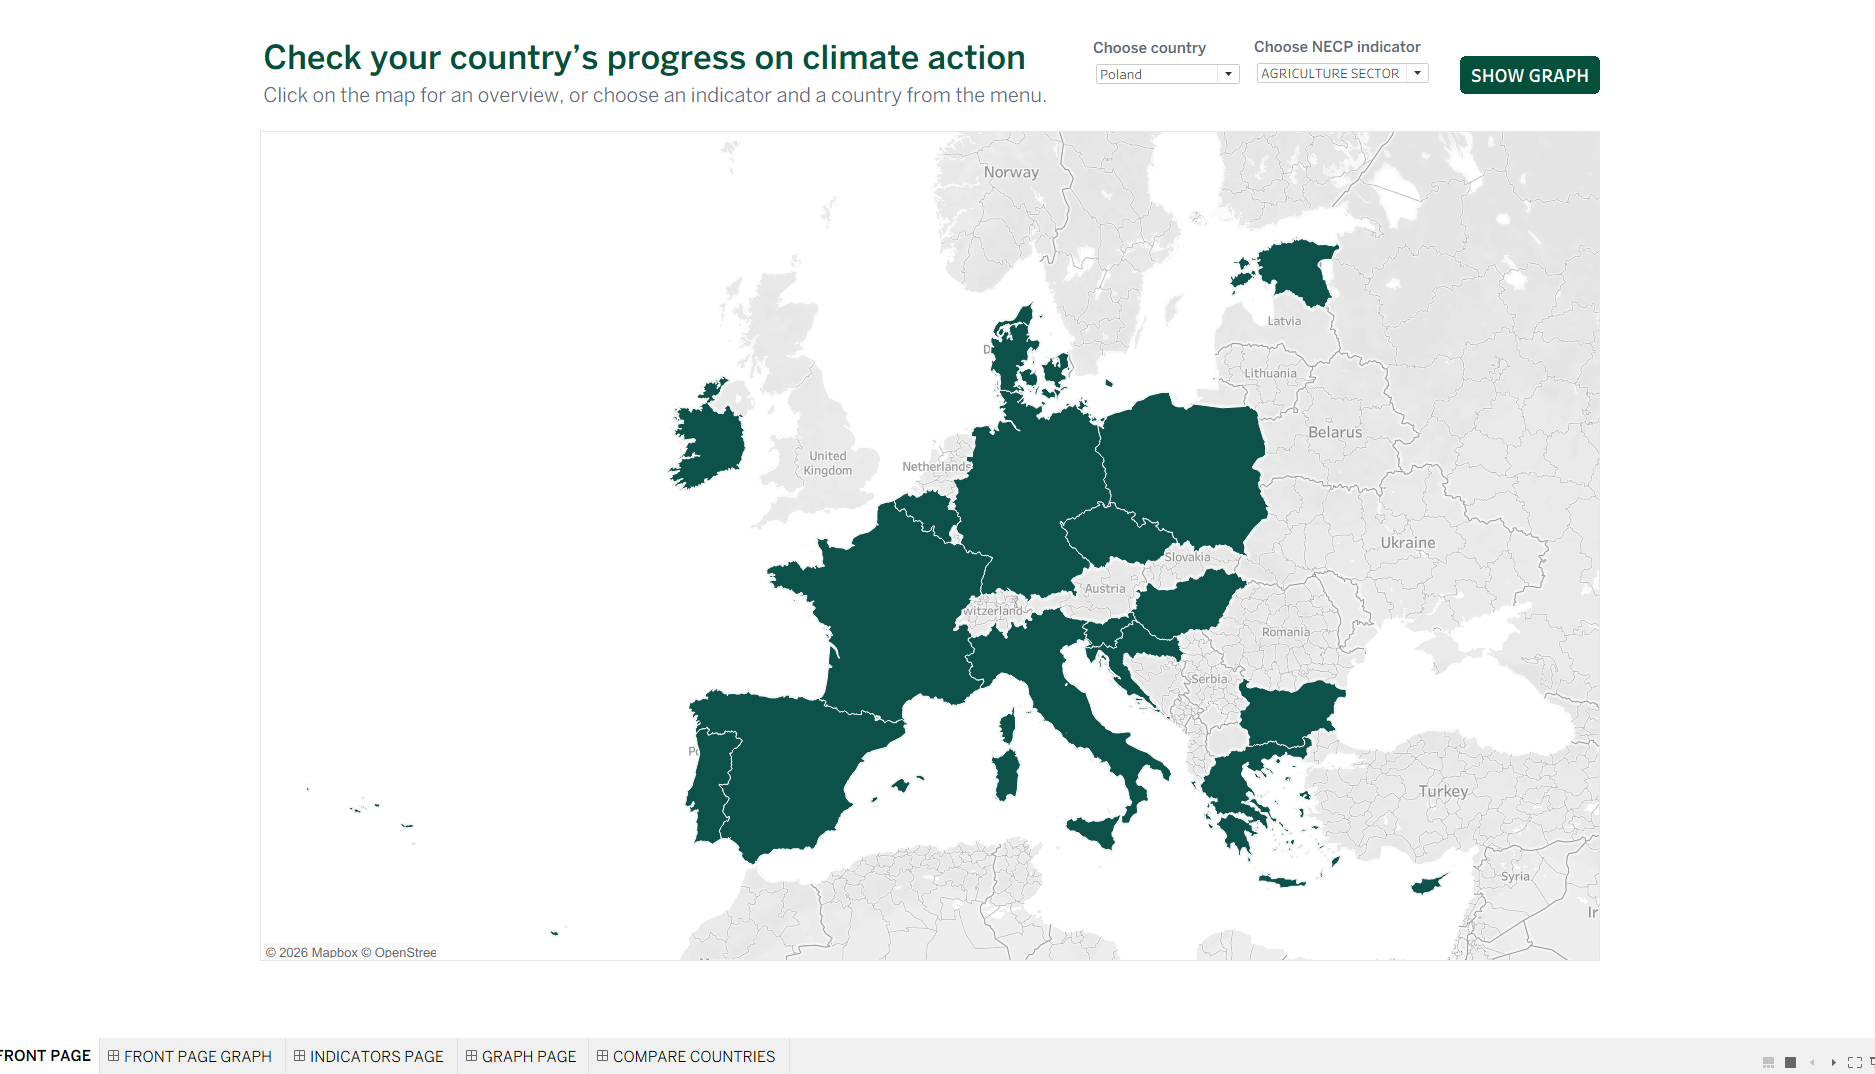
We connect your data and automate Power BI and Tableau reporting, so your team can focus on the decisions.
30 minutes. A clearer bottleneck. A practical next step.
ORGANISATIONS WE’VE WORKED WITH
Good data. Greater impact.
12 organisations.
A shared ambition for clearer insight.












WHAT WE DO
Still copying, pasting
and checking?
Let’s give your reporting
a better way to work.
POWER BI · TABLEAU
Connected data.
Clearer reporting.
MAKE ROOM FOR BETTER WORK
Less reporting time.
More possibility.
THE TIME BEHIND YOUR REPORTING
What could your team
get back?
Estimate the time automation could free up, and what that time is worth to your team.
Example inputs. Change them to fit your team.
Example costs below. Replace them with your expected budget.
Yearly value of time freed up
€50,960 time value − €10,000 project cost − €2,400 yearly costs.
The time needed for the estimated staff-time value to cover the project cost, after ongoing costs. This is not a cash-flow forecast.
How is this calculated?
- 01Time freed up each week
40 hrs × 70% = 28 hrs
- 02Time freed up each year
28 hrs × 52 weeks = 1,456 hrs
- 03Value of that working time
1,456 hrs × €35/hr = €50,960
Time-value payback = €10,000 ÷ ((€50,960 − €2,400) ÷ 12). That’s approximately 2.5 months.
Uses 52 reporting weeks per year and eight hours per workday. For seasonal reporting, enter your yearly team hours divided by 52. Assumes the full time reduction from the start; rollout time and gradual adoption are not included.
The reduction is an assumption you control, not a promised result. The yearly figure is before project costs; actual results depend on your data, reporting process and adoption.
A SIMPLE WAY FORWARD
From the first call
to your team’s everyday.
Find the bottleneck.
Understand the reporting routine and choose the change that matters.
Build it together.
Connect the data, design the dashboards and validate the numbers.
Make it yours.
Clear handover, documentation and support when you need it.
ONE USEFUL CONVERSATION
What’s slowing
your reporting down?
Bring the problem. Leave with a clearer bottleneck
and a recommended next step.